The situation
CNaught is a voluntary carbon market platform that helps companies buy portfolios of vetted carbon credits. I came in on contract to cover two simultaneous leadership gaps, with marketing running but unowned. Paid search, email, organic and social were each running on their own, with no single plan tying the year together. The brief was to take the whole function and make it operate as one.
Reframing paid search from decline to scaling
Leadership believed Google Ads performance had declined. The data put the problem a level down. Ad relevance scored “above average” while landing page experience scored “below average” across the board, and new keywords entered the account at the lowest quality tier because every search, whatever the intent, landed on one generic page. The fix was intent-level landing page routing, rebuilt ads, and a restructured negative keyword list. One ad group’s cost per lead fell by roughly half.
The landing page fix isn’t about why things got worse. It’s about how we scale efficiently from here.
Over the six months after I took over the account (Apr–Sep 2025 vs. Oct 2025–Mar 2026), paid conversions grew 155% while cost per lead held flat, so the channel scaled its output without scaling its efficiency cost.
The reframe mattered as much as the fix. Account-average CPL was rising for a healthy reason: newly launched keywords carry a quality penalty at the start, so a rising average during expansion is the fingerprint of growth, not decline. I turned that into the leadership narrative, which moved the conversation from “why did this get worse” to “how do we scale efficiently from here.”
The judgment call I’m most glad I made was one I stopped. A lead-tracking bug was surfacing paid leads as direct traffic, and the obvious fix was to add a tracking embed. That embed would have double-tracked against the existing pipeline and buried the real bug for months. I killed it, pulled raw event data, and traced the break through four layers to its root cause, then handed over a developer ticket with event-level evidence and a test procedure.
People search “carbon credits trading platform,” see an ad about a platform, and land on a generic homepage.
02 · Paid efficiency · Google Ads
Before → after
Paid conversions
At flat cost per lead
+155%
Two and a half times the conversions at the same cost per lead.
Best campaign
5.08%
Conversion rate on the beta campaign, which is what earned it a bigger budget.
Cost per lead
Flat
Held within a dollar across both windows.
The AI emissions content thesis
The obvious play for a carbon credit company writing about AI emissions is to position credits as the answer. I argued the opposite spine: reduce first, and frame credits narrowly, around immediacy, embodied carbon, and the residual emissions left under disclosure requirements. Offsets aren’t the primary reduction lever, and dressing them up as one would have read as opportunistic to a technical audience. That’s the fastest way to lose the people you most need to convince.
That thesis drove the AI data center emissions content, which became some of the most-read on the site and opened the company to search terms it had no presence on before. The writing took a highly technical concept and made it legible for the sustainability leaders actually weighing these decisions.
What I’d point to isn’t the pieces I wrote. It’s that the team went on to build a further series on the same spine after I set it, which is a better test of a content thesis than any single article’s performance.
This is the part that builds while you sleep.
03 · Organic performance · cnaught.com
Before → after
Average position
Lower is better
28.2 → 8.6
Page three to the top of page one — the whole study in one number.
Search impressions
187K → 393K
2.1× the impressions on the same site, no paid support.
Referring domains
~230 → 352
+122 domains earned, no paid link placements.
Clicks grew alongside impressions, though click-through rate dipped from roughly 1% to 0.7% as the content ranked for a wider set of informational queries — the expected tradeoff of expanding reach into top-of-funnel search.
04 · Published artifact · live
The asset
the numbers describe
Strategy → brief → published
cnaught.com/blog/how-to-actually-measure-the-carbon-footprint-of-ai-code
Published Mar 24 2026 · CNaught blog
Strategy, brief & edit by Comarketer.ai
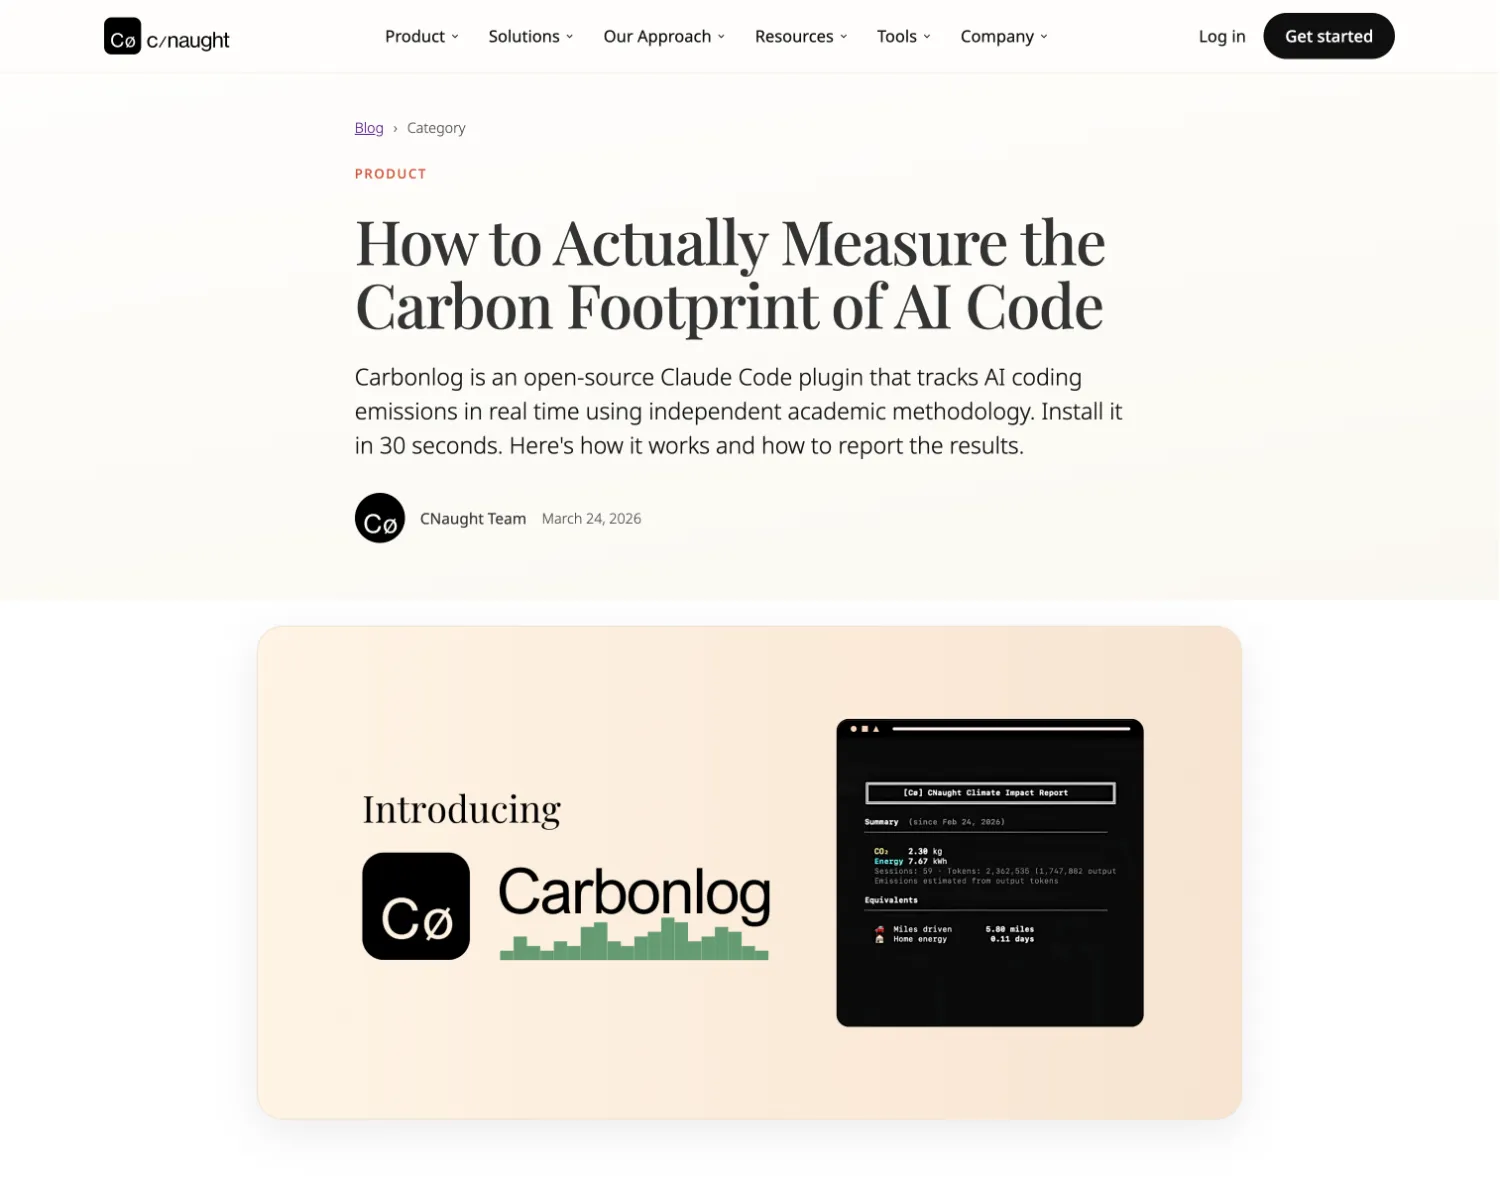
The Carbonlog launch
Carbonlog is an open-source plugin that measures the emissions of AI-generated code, and I took it to market end to end: the announcement post, a wire release, an install video, the social program, and a launch-day toolkit so everyone internally described it the same way. The research behind it needed nine interactive charts, which I built in Webflow so the numbers could be cited rather than screenshotted.
It’s the clearest example of the shape of the engagement. The paid-search work is the sharpest single decision on this page, but the job was a function, not a channel.
Apr 2025 – Mar 2026
Full scope
The stories above carry the argument. Everything below ran inside the same engagement — one channel operation, catalogued.
- 17
- workstreams
- 6
- public, linked
- 4
- channels
01Paid & SEO
5 workstreams · none public
Google Ads rebuildPaid campaign
Account restructured to intent, then six months of hands-on management.
Landing routing & negativesAccount structure
Intent-level page routing, ads rebuilt, negative keyword list restructured.
Keyword-to-content mapStrategy doc
Organic strategy tying every target query to a commissioned piece.
Two LinkedIn ad programsPaid campaign
Rebuilt and run end to end; neither reached efficient conversion.
Attribution investigationInvestigation
Traced paid leads misreporting as direct; handed developers a test procedure.
02Content & editorial
4 workstreams · 3 live
AI data center emissionsArticleLive
The thesis piece, and the spine the team built a further series on.
View it live →The Carbon, ConsideredInterview seriesLive
Interview-led series on the business cases that actually close sustainability deals.
View it live →Blog cadence & briefsEditorial program
Commissioned and edited against the keyword map, written for a technical reader.
Customer case study & videoCase study + videoLive
Interviewed, written, and produced with the customer’s team.
View it live →03Lifecycle & email
4 workstreams · 1 live
Email lifecycle rebuildEmail flows
Triggered and nurture flows rebuilt on a repaired sending domain.
Sender reputation repairDeliverability
Health score brought from four to six without pausing sends.
CNaught PerspectivesNewsletterLive
Newsletter positioning, cadence, and copy for the leadership audience.
View it live →Cold email infrastructureInfrastructure
Built from scratch with Clay and Instantly, warmed and handed over.
04Launches & campaigns
4 workstreams · 2 live
Carbonlog launchProduct launchLive
Open-source emissions plugin taken to market end to end, cited in Google’s AI Overview.
View it live →Nine interactive chart embedsData visualization
Built so the launch research could be cited rather than screenshotted.
2025 Wrapped campaignSocial campaignLive
Year-in-review social push built from the platform’s own retirement data.
View it live →70-item GTM calendarOperating plan
The team’s operating document for the year, and it outlasted the contract.
The bottom line
The 70-item GTM calendar became the team’s operating document for the year and outlasted the contract, and the AI emissions thesis shaped content direction well past my involvement.
The thing I’d hand over first, though, is a standard rather than a number. Early in the engagement I built source verification into the account: every statistic marked verified, unverified or needs-verification, with a traceable source attached before it could reach a draft. It later caught my own best figure. I had a cost-per-lead improvement pulled from a single fourteen-day window, and the standard said it wasn’t representative, so I replaced it with a weaker account-wide number that was. Absolute spend and revenue figures live in the client’s systems and stay there.